Welcome! In this blog series I will share some of the knowledge I gained when doing performance optimizations for a project some time ago. Optimizing code for performance requires good knowledge of the fundamental concepts of computer architecture. In this first blog post I will explain about software profiling, some of the computer architecture concepts and my personal experience what worked for my and what did not. In later post(s) I will go more into detail in how to optimize code for performance.

About a year ago I was challenged to improve the overall application performance of a C# WPF application. The application was built for a steel plate inspection system. Using ultrasound, the system is capable of detecting defects in steel plates. For your imagination, these steel plate could go up to 40 by 5 meters (pretty huge). One of the main functions of the application is to receive and parse streams of data which were send by an FPGA via TCP. After parsing the characteristics of a “shot” were being calculated and a 3D model of the steel plate is updated and displayed in near real-time.
When I joined this project, it was already running for about two years and the first prototype was built. This machine contained 1 FPGA and a single transceiver probe. At that time there were already signs of performance issues. But before we could start improving the software, we had to polish the existing application for its first customer. Because of time pressure the machine needed to be sold and the next generation had to be built as well. This next generation machine contained 20 FPGA’s and 80 transceiver probes. These requirements were getting more serious but theoretically this would not be a problem.
Some time went by and more and more code were added, the customers wishes changed, the principal system architect left the project and no replacement was ever found. Engineers with different ideas have come and gone. The “legacy” code base was dying to get an update! I remember when connecting more than a single FPGA device the software would completely freeze the computer. We were hitting a wall! The software architecture was not scalable at all…
You might have found yourself in such a situation. When experiencing performance issues, you will find yourself very quickly in a new world with software profilers. Profilers such as the one embedded in Microsoft Visual Studio, Intel VTune Profiler, Reshaper tools such as dotTrace or dotMemory.
Profiling
Software profiling is about getting metrics/samples about the application or system-wide used resources like CPU, RAM or GPU. These metrics can give insight in how fast code is executed, what memory is being allocated, how well the code is being executed in parallel, etc…
Sampling can be done in two different ways: User mode Sampling and Hardware Event-Base Sampling (Interrupt). In order to use User Mode sampling the profiling application has to inject and recompile the program in order to get the application metrics. Using this method, the metrics will be time based and acquiring these metrics has about 5% overhead on the overall system performance.
On the other hand, Hardware Event-Based Sampling uses the PMU. Every modern CPU nowadays contains a Performance Monitoring Unit (PMU). The PMU can sample data per number of cpu-cycles or can be triggered when a specific instruction is executed. Since this is hardware embedded on the CPU it is able capture metrics of the whole system. and it has a minimal performance overhead.
Below a small comparison table between these two sampling methods.
| User mode Sampling | Hardware Event-Based Sampling |
|---|---|
| Time-Based Sampling (TBS) | Performance Monitoring Unit (PMU) |
| ~5% overhead | Minimum overhead |
| Application resources only | System-wide resources |
| Inject code into binary | Uses system interrupts |
Hotspots
Code “hotspots” refer to functions in the call stack which are executed very often. Reducing the execution time or the amount of times executing the operation can result in faster overall execution time of your program, by making room for other operations.
When it comes to finding these hotspots, I personally prefer using Intel VTune Profiler’s Hotspot analysis. Intel VTune has a clear overview, visualizing the top hotspots and allowing the user to easily traverse the call stack.
Memory Allocation
Allocating new memory reserves a block of memory on the stack, heap or virtual memory. Both the stack and heap are physically located in RAM (Random Access Memory). If you are new to the concepts stack or heap or just looking for a refresher; The stack is a fixed size block of memory reserved for the execution of a thread. In processes each thread has its own stack. A stack is a LIFO (last in first out) and consists of stack frames. On each function call a new stack frame, containing local variables, is added. When a function exits the stack frame is popped from the stack, releasing the allocated memory automatically. Due to the fixed size of the stack it is possible to run out of memory, this results in a StackOverflow Exception. The stack size is determined at application startup and depends on the system architecture and operating system.
The heap is memory reserved space for dynamic memory allocations. Dynamic allocations have a different lifecycle that needs to be managed by the application runtime. This can be manually where the program needs to explicitly free the memory by using free or delete or by a Garbage Collector, like in .NET. Unlike the stack that can throw an exception when it overflows, the heap is able to also make use of virtual memory. Virtual memory is memory that can be located on a hard disk, which has considerably slower access times than reading from RAM (latency). The process of running out of RAM memory and making use of virtual memory is called swapping.
To put the latency numbers in perspective.
Latency Comparison Numbers (~2012)
----------------------------------
L1 cache reference                           0.5 ns
Branch mispredict                            5   ns
L2 cache reference                           7   ns                      14x L1 cache
Mutex lock/unlock                           25   ns
Main memory reference                      100   ns                      20x L2 cache, 200x L1 cache
Compress 1K bytes with Zippy             3,000   ns        3 us
Send 1K bytes over 1 Gbps network       10,000   ns       10 us
Read 4K randomly from SSD*             150,000   ns      150 us          ~1GB/sec SSD
Read 1 MB sequentially from memory     250,000   ns      250 us
Round trip within same datacenter      500,000   ns      500 us
Read 1 MB sequentially from SSD*     1,000,000   ns    1,000 us    1 ms  ~1GB/sec SSD, 4X memory
Disk seek                           10,000,000   ns   10,000 us   10 ms  20x datacenter roundtrip
Read 1 MB sequentially from disk    20,000,000   ns   20,000 us   20 ms  80x memory, 20X SSD
Send packet CA->Netherlands->CA    150,000,000   ns  150,000 us  150 ms

Notes
-----
1 ns = 10^-9 seconds
1 us = 10^-6 seconds = 1,000 ns
1 ms = 10^-3 seconds = 1,000 us = 1,000,000 ns

Credit
------
By Jeff Dean:               http://research.google.com/people/jeff/
Originally by Peter Norvig: http://norvig.com/21-days.html#answers

Contributions
-------------
'Humanized' comparison:  https://gist.github.com/hellerbarde/2843375
Visual comparison chart: http://i.imgur.com/k0t1e.png
Allocating memory on the stack is faster than on the heap. This is due to that each allocation on the heap requires searching for a block which is big enough to fit the data in or even splitting the data over multiple blocks while guaranteeing thread-safety.
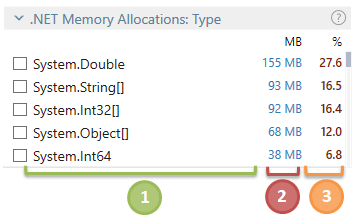
When profiling for memory allocations I found that Resharper dotTrace works for me best. Here is why:
- Clear overview of total memory usage within the profile snapshot.
- Allows filtering by memory type.
- Allows filtering of memory allocations within a selected timeline.
- Allows filtering of memory allocations per thread.
- Visually shows Garbage Collector run time.
- Visually shows UI freezes due to excessive memory traffic and Garbage Collections, blocking the main thread.
Microarchitecture
The CPU contains allot of optimizations to maximize the performance. Examples of these feature are caching and branch prediction. Even when the CPU facilitates optimizations, they can also work against you, so being aware of how the CPU works is essential when writing good code. I recommend watching this video; Understanding CPU Microarchitecture to Increase Performance, where Alex Blewitt talks about: the CPU layout, caching, the memory layout, execution units and scheduling.
While on average branch prediction is about 95% of the times right, it can become expensive. Writing branch-free code would eliminate branches predication completely but this is not achievable for all software. Daniel Lemire wrote an excellent article about removing branches: Making Your Code Faster by Taming Branches.
Intel VTune Profiler offers great insight in the Microarchitecture bottlenecks of your system processes or a single application. It gives insight in:
- Code that causes memory stalls because of inefficient reads or writes (hot memory access)
- Code which is delayed because of longer memory read/write latency due to the memory being stored in an older memory cache generation (L1, L2, L3 or in RAM).
- Branch mispredictions
- Availability of Pipeline execution slots
Threading Efficiency
Each process has its own resources in order to execute a program such as; virtual address space, executable code, open handles to system objects, a security context, a unique process identifier, environment variables, a priority class, minimum and maximum working set sizes, and at least one thread of execution. The first thread is often called primary thread or main thread.
A thread, linked to a process, can be scheduled for execution. Each thread shares the virtual address space and system resources of a process. In addition, each thread maintains exception handlers, a scheduling priority, thread local storage, a unique thread identifier, and a set of structures the system will use to save the thread context until it is scheduled. The thread context includes the thread’s set of machine registers, the kernel stack, a thread environment block, and a user stack in the address space of the thread’s process. Threads can also have their own security context, which can be used for impersonating clients.
Multiprocessors computers can execute in parallel as many threads as there are processors. A part of the kernel called the scheduler manages the threads when they are executed as well as the amount of time they have to execute (timeslice or quantum). The scheduler is basically a load balancer to keep all computer resources busy. When the scheduler switches between threads there is overhead due to booking, this is called context switching. Ideally you would want to limit the amount of threads to the amount of CPU cores in your program to maximize performance by reducing context switching. This sounds like a perfect solution, but there will always be context switches due to other running processes on the operating system. It is hard to put a number on what the costs are of context switching. In general, the cost of context switch ranges from several microseconds to more than one thousand microseconds depending on CPU architecture and program cache sizes.
All threads can access and modify data on the heap. If multiple threads access the same resource and at least one of them will be writing, you need to protect the critical section. To achieve thread-safeness you can:
- Confinement: don’t share data between threads.
- Immutability: make the shared data immutable.
- Use existing thread safe data types: use a data type that does the coordination for you.
- Synchronization; prevent threads from accessing the shared data at the same time.
Looking back at Memory Allocation, we know that the .NET Garbage Collector(GC) automatically searches for resources which can be released. Now, take threading into the equation with the GC; Heap resources are shared by all threads and shared resources need protected when accessing them. Say if many objects with a small lifetime are being allocated, the GC will need more time to release those resources, resulting in all other threads being blocked by the GC. Eventually, stressing the GC can result in a snowball effect that can be experienced by UI Freezes, where the operating system temporary seems to be unresponsive.
Threading efficiency boils down to the amount of time threads must wait for synchronization due to the amount of executions by a thread inside a critical section of a shared resource, resulting in bad CPU utilization. Parallel performance suffers when waits occur while cores are under-utilized.
For me Intel VTune Profiler’s Threading Analysis helped to analyze thread wait time and find synchronization bottlenecks best, while Resharper DotTrace had a better overview of the allocated memory, UI Freezes combined with the time in GC.
Even though there is no straightforward answer to every problem, problems tend to have things in common. In my next performance post, we will visit some of these common issues including examples and solutions.
I hope you enjoyed this long read, until next time!
Thomas
Resoures
Even more details can be found in the following pages.
- Understanding CPU Microarchitecture to Increase Performance - Alex Blewitt
- Making Your Code Faster by Taming Branches - Daniel Lemire
- Latency Comparison Numbers (~2012) - Jonas Bonér
- About Processes and Threads - Microsoft
- Quantifying The Cost of Context Switch - Chuanpeng Li, Chen Ding, Kai Shen
- Reading 23: Locks and Synchronization - MIT